Stress Fracture (Ankle/Foot) on MRI & X-ray: Imaging Findings
Stress fractures of the ankle and foot are overuse injuries caused by repetitive submaximal loading that exceeds the bone's ability to remodel. They are common in runners, military recruits, and athletes who rapidly increase training intensity. The metatarsals (especially the second and third) are the most frequently affected bones, followed by the calcaneus, navicular, and distal fibula. Navicular stress fractures are particularly concerning due to their tenuous blood supply and high risk of nonunion. MRI is the gold standard for early detection, identifying bone marrow edema and fracture lines before they become visible on plain radiographs.
Common Symptoms
- Insidious onset of ankle or distal leg pain correlating with a recent increase in athletic training load
- Point tenderness on the medial malleolus, distal fibula, or anterior distal tibia reproducible with direct pressure
- Pain aggravated by activity and relieved by rest, with progressive worsening over days to weeks if training continues
- Localised soft-tissue swelling without significant ecchymosis, distinguishing it from acute ankle fracture
- Positive fulcrum test — pain elicited when longitudinal loading is applied to the bone distal to the suspected fracture site
- Night pain or rest pain at the anterior tibial cortex in medial tibial stress syndrome progression to tibial stress fracture
What We Look For on Imaging
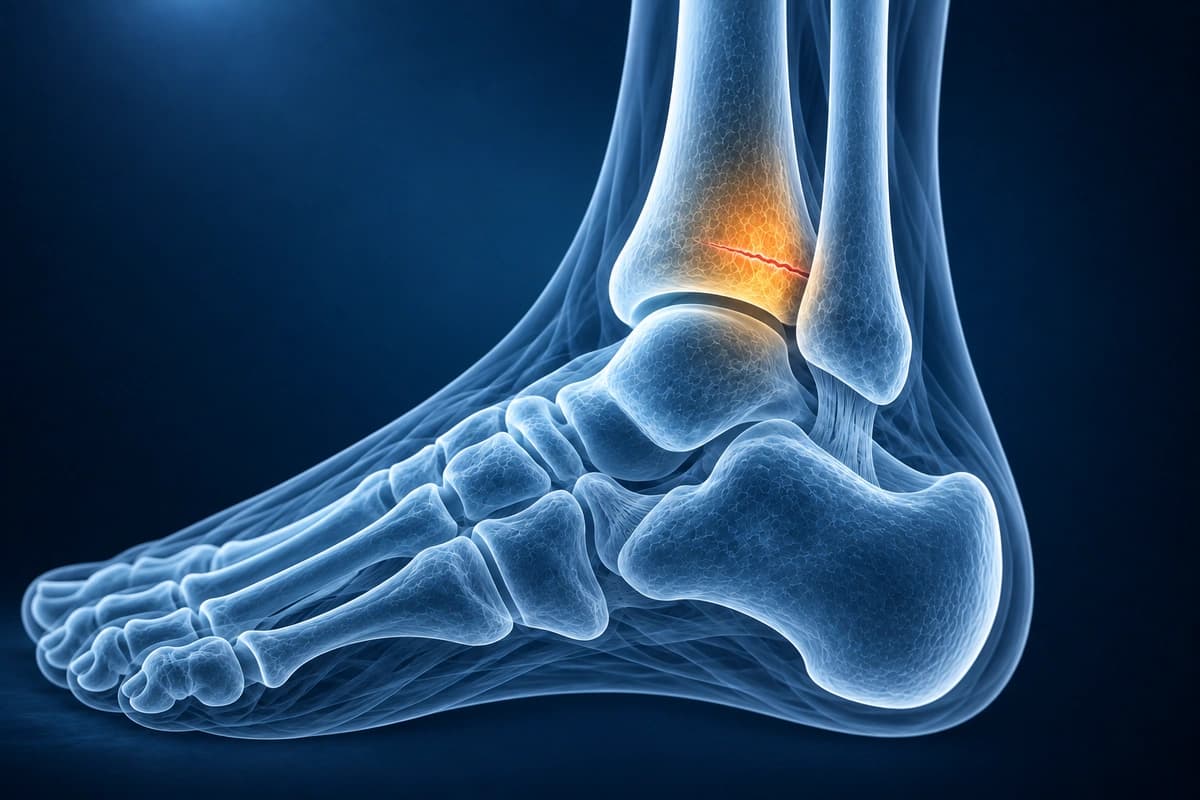
- Bone marrow edema on fluid-sensitive MRI sequences indicating stress reaction
- Low-signal fracture line within the edematous bone on T1-weighted images
- Periosteal reaction and cortical thickening visible on X-ray in later stages
- Endosteal callus formation and sclerotic band at the fracture site on radiographs
- Navicular dorsal cortex fracture line on sagittal MRI, a high-risk stress fracture
- Periosteal edema and adjacent soft tissue swelling surrounding the fracture
Frequently Asked Questions
Why is MRI the gold standard for ankle stress fractures, and what does it show?
Plain radiographs miss up to 70% of stress fractures in the first 2 weeks. Bone scintigraphy is sensitive but non-specific. MRI is the reference standard because STIR and T2-FS sequences detect periosteal and endosteal marrow edema — the earliest stress response — before cortical fracture line formation. A true stress fracture line appears as a low T1/T2 band within the marrow edema. MRI also assesses cortical break width on T2-FS, stratifying low-risk (posterior cortex) from high-risk (anterior tibial cortex, medial malleolus, navicular, and fifth metatarsal base) stress fractures with significantly different non-union and complication rates.
How does AI classify stress fracture severity grades on MRI?
The Fredericson MRI grading system (I–IV) is the most applied: Grade I shows periosteal edema on STIR only with no marrow signal change; Grade II adds marrow edema on T2-FS; Grade III shows marrow edema on both T1 and T2-FS without a fracture line; Grade IV demonstrates a discrete intracortical or intramedullary fracture line. AI can help explain these grading terms, but it has not been validated to assign a clinical grade or set a return-to-sport date. Your clinician must confirm the injury and guide recovery.
Which ankle stress fractures are considered high-risk and why does imaging precision matter?
Medial malleolus, navicular, anterior tibial cortex (tension side), and fifth metatarsal base (Zone 2–3) stress fractures are classified as high-risk due to tenuous blood supply and high non-union rates. Precise MRI characterisation — fracture line length, cortical displacement, and intramedullary extension on sagittal and coronal sequences — determines whether non-weight-bearing cast immobilisation or prophylactic screw fixation is required. For navicular stress fractures, CT complements MRI by defining dorsal cortical break extent. AI can help explain report wording, but a clinician must confirm fracture measurements and decide how to protect or treat a high-risk injury.
Sources
- Fredericson M, Bergman AG, Hoffman KL, Dillingham MS. Tibial stress reaction in runners. Correlation of clinical symptoms and scintigraphy with a new magnetic resonance imaging grading system. Am J Sports Med. 1995;23(4):472-481.
- Arendt E, Agel J, Heikes C, Griffiths H. Stress injuries to bone in college athletes: a retrospective review of experience at a single institution. Am J Sports Med. 2003;31(6):959-968.
- Boden BP, Osbahr DC. High-risk stress fractures: evaluation and treatment. J Am Acad Orthop Surg. 2000;8(6):344-353.
- Wright AA, Hegedus EJ, Lenchik L, et al. Diagnostic accuracy of various imaging modalities for suspected lower extremity stress fractures: a systematic review with evidence-based recommendations for clinical practice. Am J Sports Med. 2016;44(1):255-263.
Related Articles
Learn when 3T ankle MRI can help for cartilage lesions, peroneal tendons, syndesmosis injuries, and occult fractures, and when X-ray or 1.5T MRI is enough.
Understand your ankle MRI report including ligament evaluation, tendon assessment, and osteochondral lesion detection.
Understand your imaging before your next appointment
MRI, X-ray or CT from a CD, folder or ZIP. A PDF report or photos of the films work too.
Free to open and preview, no account needed. An optional AI report from $10 explains your images in plain language, with questions for your doctor.
Your raw files stay on this device. Only rendered images and minimal context are sent when you request an AI report.
Medical Disclaimer: This page is for informational and educational purposes only. It does not constitute medical advice, diagnosis, or treatment. AI-generated analysis may contain errors. Always consult a qualified healthcare professional for medical decisions. Full Disclaimer